Building The Analytics Team At Wish Part 2 — Scaling Data Engineering
Now that the infrastructure is rebuilt, in part 2 we’ll talk about how to build and manage a high performance data engineering team.
Setting a Vision for the Team
Data engineering exists on a spectrum between two poles.
On one end is the traditional data engineering team, where the goal is to build and own the data pipelines that data analysts and data scientists use to output data. On these teams, the majority of work is spent helping people access data, and producing new pipelines if needed.
While this works, the main drawback is that it’s easy for this type of team to become a cog in the system. The work can become monotonous, and visibility into wins are low. Generally, it will be hard to recruit and retain strong talent.
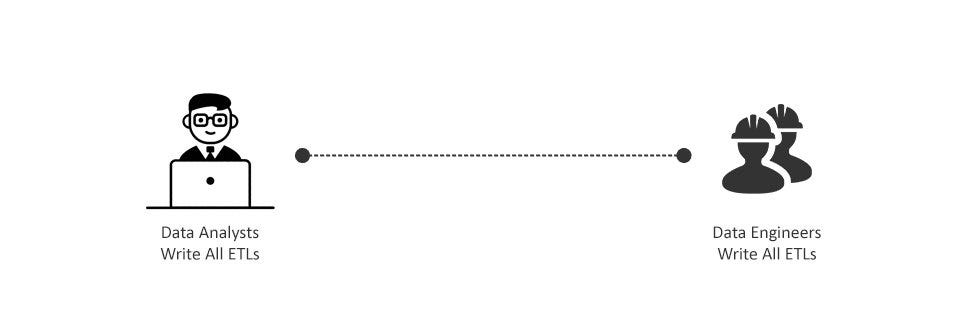
On the opposite end of the spectrum, data engineering teams build and maintain platforms and frameworks where anyone can write and run their own data pipelines, and they themselves do no pipeline work.This allows analysts and data scientists to own their work end to end. You can read more about this philosophy here.
This works best if you want to optimize for recruiting top talent. The best engineers want to work on scaling systems and platforms, and this setup offers plenty of technical challenges. This also greatly increases the productivity of top analysts, where they no longer have any external dependencies to produce their work.
But there’s two drawbacks:
- There’s an explosion of tables since it’s often easier writing new pipelines than digging up and auditing old ones. This leads to inconsistent metrics across reports & analysis. This also minimizes the re-usability of pipelines.
- The infrastructure costs required to support this is much higher. ETL jobs written by analysts aren’t always optimal based on query performance. So capacity needs to be upped significantly to buffer this.
Unless there’s existing factors that call for choosing one of the two extremes, the optimal solution is somewhere in the middle.
Data engineering should build a system that allows analysts to produce their own pipelines. But they should also be the ones building core event and dimension tables on top of each system in the company.
These system tables should have a high degree of quality and trust, and should form the foundation of ETL tasks built out by the rest of the company. Data engineering should set SLAs for these tables, and cover them with tests and monitoring.
Data engineering should also handle the operational tasks needed to maintain an open data platform.
As non system tables grow, data engineering should also be on the lookup for refactoring opportunities. Unless there’s unlimited compute and storage resources for data, inefficient data models can be detrimental to the system.
And lastly, data engineering should always be on the lookup for systems improvements. The goal should be to increase analyst productivity. For example, if analysts are repeatedly calculating week over week metrics for every metric they product, then data engineering can build out a library or process to make this automatic and save time per ETL build task.
Building The ETL Framework
The data platform at the minimum needs the following features
- Run tasks that are uniquely defined by a key (most of the time, key=date)
- Enable dependencies to be defined between tasks
- Handle exceptions in tasks (retry or quit)
- Able to define what task completion means
- Idempotent — does not run completed tasks
- Able to send out notices when things fail
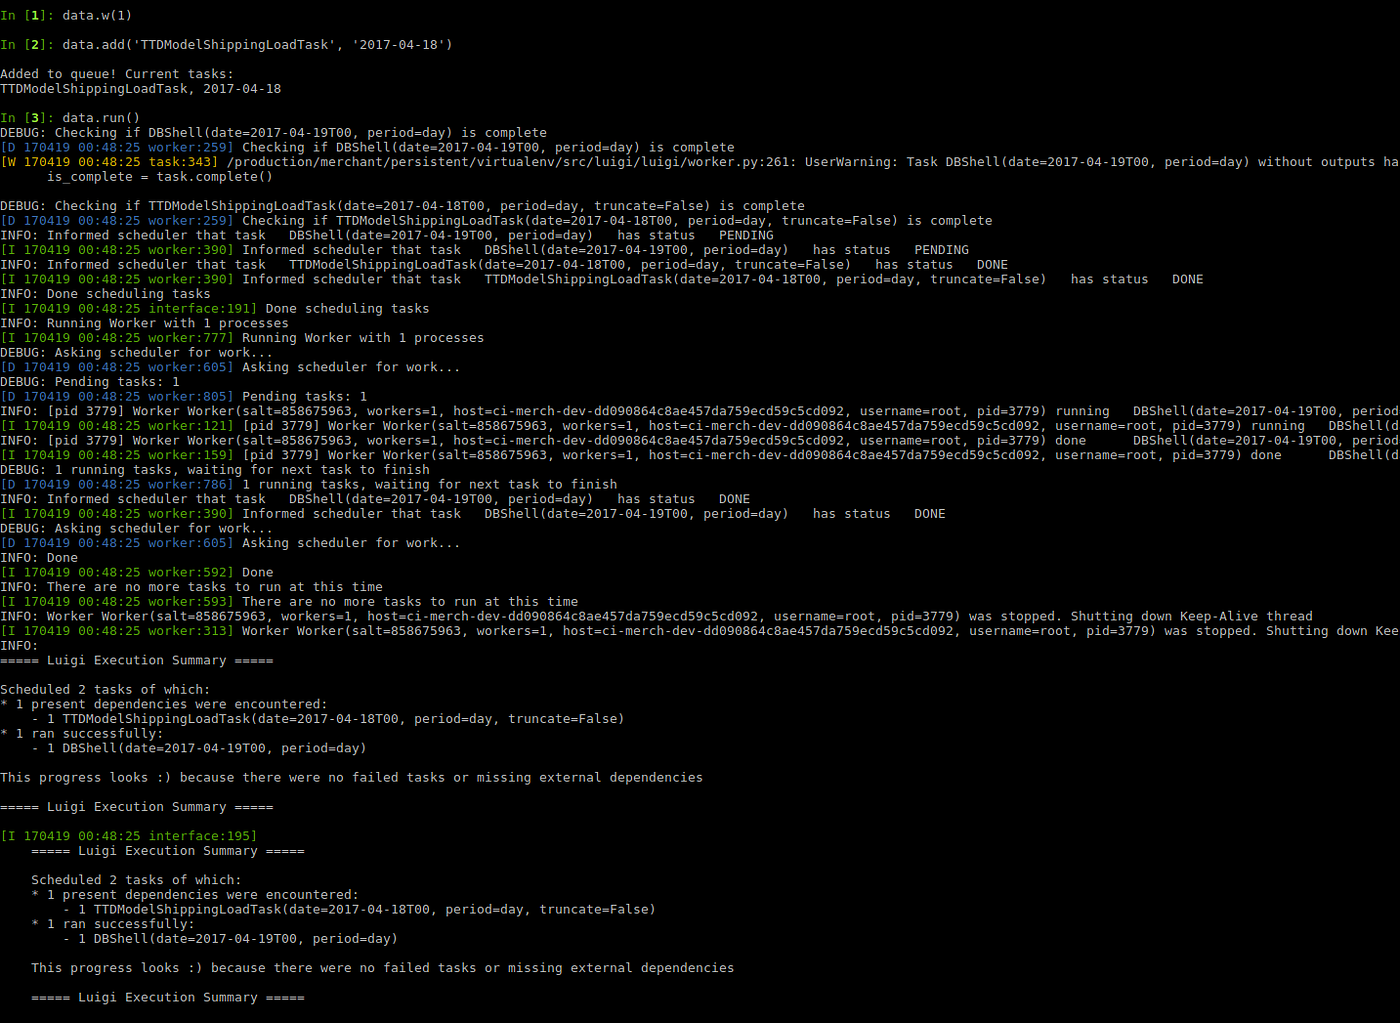
Luigi handles all of these fairly well off the shelf. Our initial rewrite of the data pipeline based on Luigi ran reasonably smooth. And was able to recover quickly when it didn’t.
However, as we added more headcount that needed to build on top of the pipeline, flaws started to creep up.
- Since luigi doesn’t have a scheduler, we threw hundreds of tasks in the same task graph. However, this makes the system brittle. A single bad new tasks could break the whole pipeline.
- It was hard to perform maintenance on tasks. Backfills were tricky and involved update/delete manual operations in production MongoDB.
- Retry on failure is not okay when the task runs Hive queries. Failures that generate Hive queries can easily overload the cluster, especially if there’s dozens of them at the same time from backfilling a buggy task.
- Alerting and monitoring via emails doesn’t scale as dozens of people start adding to the data pipeline. The data pipeline eventually regularly sent out hundreds of emails a day, which is hard to triage and monitor.
To these problems, we’ve been able to build out some simple solutions:
- We’ve split the graph into four main components. One for company wide core tasks, one for Platform team core tasks, one for Data team core tasks, and one graph per analyst writing their own tasks. This isolates the impact of bugs to the pipeline.
- We built out our own shell for running maintenance operations like forced runs and backfills.
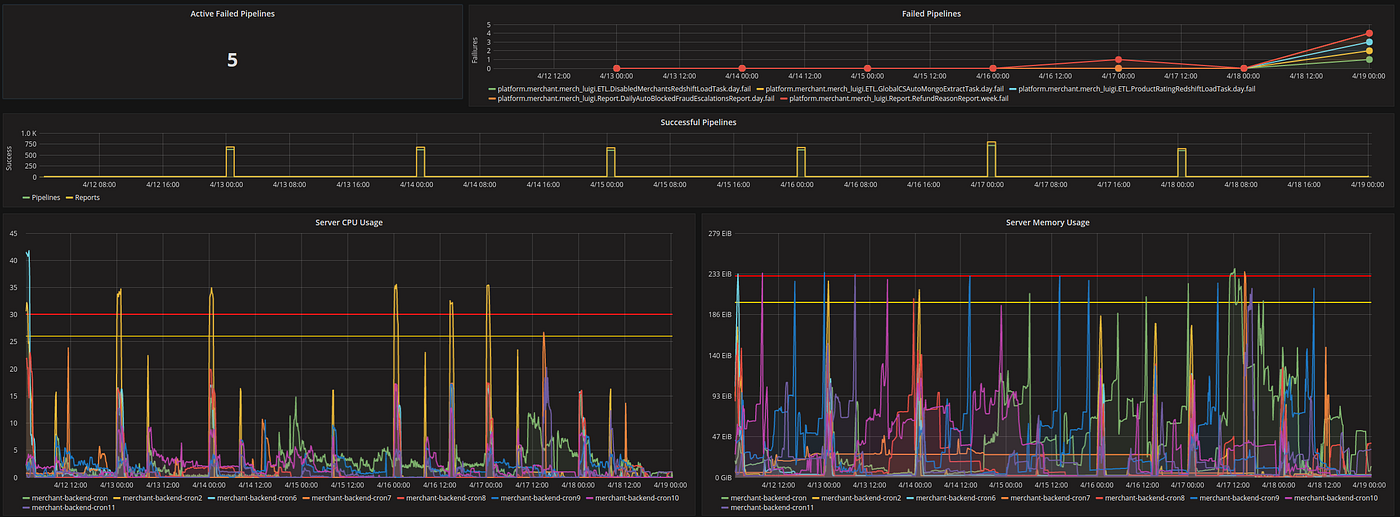
- We’ve added circuit breakers when tasks fail in certain ways, so system resources aren’t spent on bad code over and over again.
- We’ve built out our own alerting and monitoring in Prometheus + Pagerduty which allows us to react to pipeline failures and server issues.
No framework covers every edge case and need by the data team. As the team scales, data engineering needs to be on alert for pain points. A simple pipeline worked on by a handful of people all with intimate knowledge of how it works, vs a pipeline that supports over 100 contributors, including frequent new hires that have minimal knowledge of the system, look very different.
Going beyond ETL, the data platform should make certain repetitive analyses more efficient. A great post on what is possible is written by my friend Robert Chang, where he describes AirBnB’s data platform capable of automating ML pipelines, greatly reducing the work involved and opening up a large body of problems to ML solutions.
Scaling The Data Warehouse
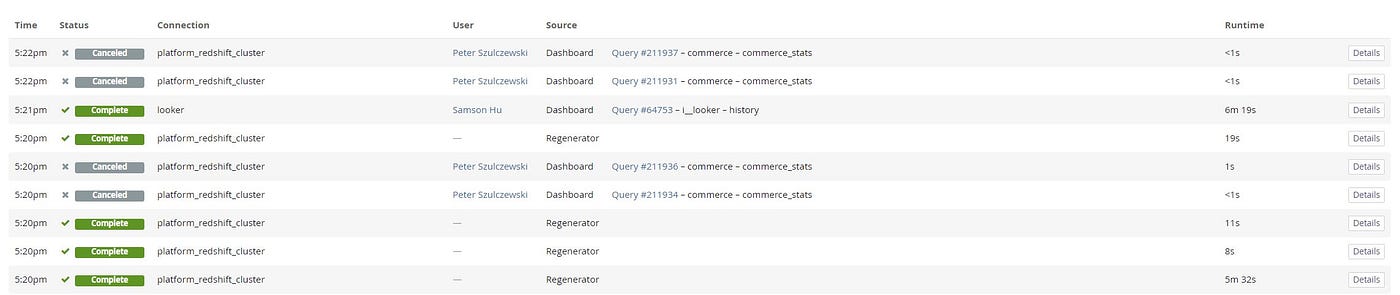
At Wish, since we have a finite Redshift and Hive cluster, we have to keep an eye on queries and tables to make sure there aren’t slowdowns to the system and that it can continue to grow.
This means regularly looking at query logs and taking note of slow running queries. Sometimes tables need to be denormalized to reduce joins. Other times, analysts that have spammed tables in new areas of the company, and redundancies need to be reduced with new systems tables.
One of the ways that we’ve been able to maintain quality, and also educate analysts, is through code reviews. ETL pipelines at Wish are still code committed to our git repo. So pull requests need to be reviewed by members of the data engineering team. This creates a feedback loop on quality.
Handling Systems Issues
For data engineering, handling operational issues with the system is core part of the job.
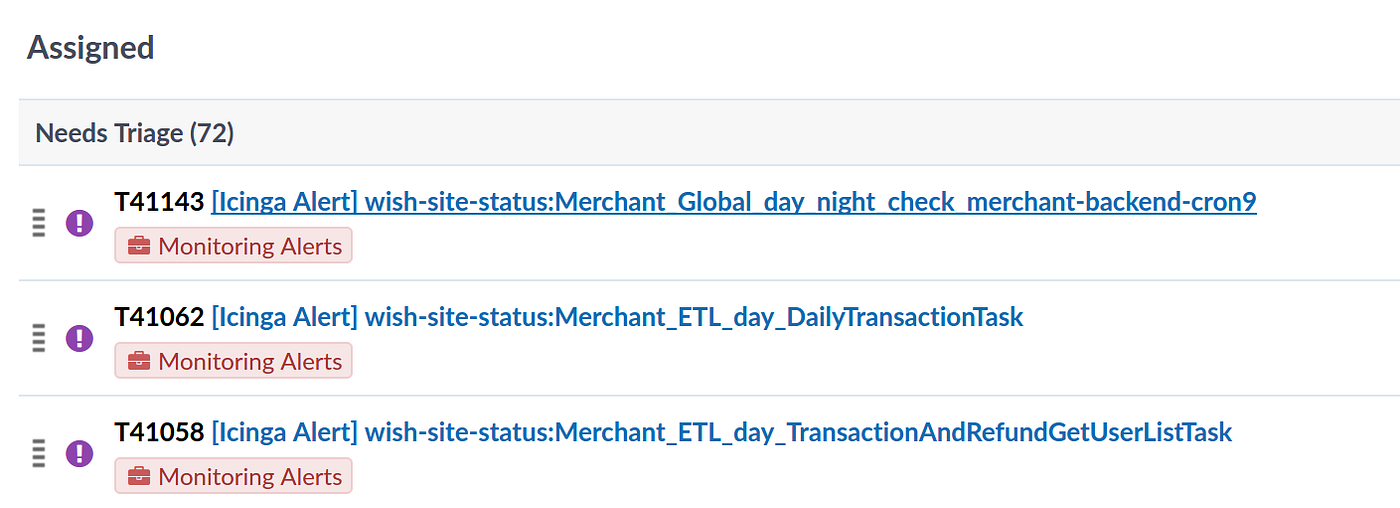
This system is complicated and generates errors. Currently we have over 1000 active ETL jobs in our pipeline written by over 60 engineers, analysts and data scientists. Some were written by people that have left the company. Others by interns, that have also left and gone back to school. This means stale code that will generate errors. Even with a 1% failure rate per week, means 10 weekly broken pipelines to fix and impact to reports and tables that people need.
To deal with regular operational issues, we have on call rotation. Each week, someone is in charge of triaging and assigning out or resolving systems issues. We try to announce systems issues proactively, and include the impact in each announcement.
Being proactive with announcing systems issues is important. It stops people from making analysis based on bad or incomplete data, and generating negative value for the company.
Fixing the root cause of recurring issues is important as the company scales. Ask the question — what if headcount 5x’ed or the quantity of data 10x’ed, would these issues still be manageable? If not, there needs to be a fix for the underlying issue.
