Building The Analytics Team At Wish
When I first joined Wish two and half years ago, things were going well. The Wish app had reached top positions on both iOS and Android app stores, and was selling over two million items a day.

Very few people believed that a large business could be built from selling low priced products. Using data, Wish has been able to test and challenge these assumptions. Being data driven was in the company DNA.
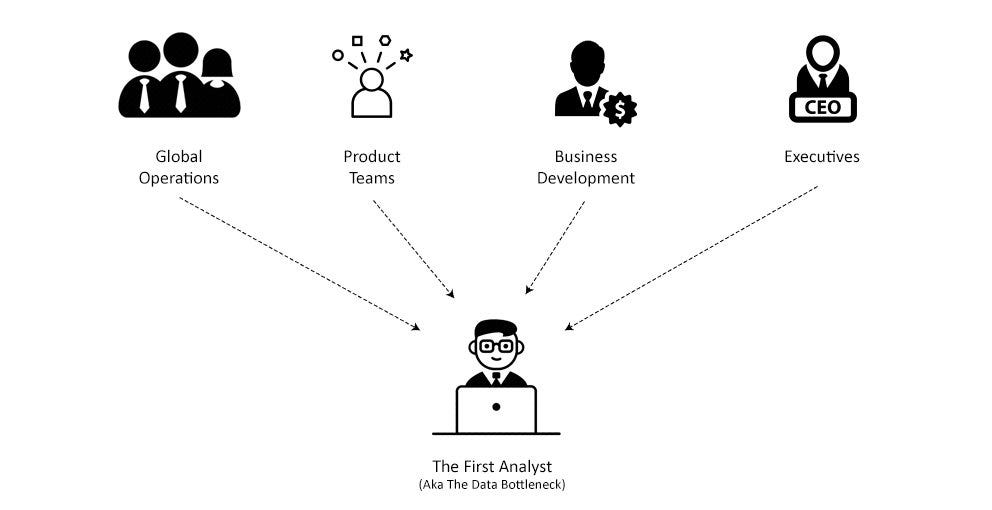
But from the company’s massive growth were huge growing pains on the analytics side. Every team needed urgent data support and had a lack of visibility into their ownership areas. But Wish’s analytics capabilities were still in its infancy and couldn’t keep up with the demand.
There were bottlenecks in accessing data. The only people that were able to build reports & pull data were engineers working on the product. Since the data infrastructure was so bare bones, we couldn’t hire data analysts to help. Data requests and reporting had turnaround times measured in weeks.
Over the next two years we worked hard to build up analytics at Wish. We built a data pipeline from the ground up that allows engineers, data analysts, and data scientists to ETL data reliably and safely to power their work. We built a data warehouse in Redshift and BigQuery with core tables that can be used to power secondary tables needed by analysts. And we rolled out Looker, now used company wide as the source of truth for data by over 200 people across three continents.
We now have over 30 people dedicated to working on analytics, with plans to double that number this year. We’re confident that our systems and processes can scale, and that we can meet any future demand held by the company.
In this post, I’m going to share the lessons we learned, and offer a roadmap for other companies looking to scale their analytics function.
This article is divided in four parts, each talking about a different focus in building a data team.
- Part 1 — Rebuilding The Foundation
- Part 2 — Scaling Data Engineering
- Part 3 — Scaling Data Analysis
- Part 4 — Recruiting
Part 1— Rebuilding The Foundation
Let’s start with the early days. Things were pretty clear after I joined that there were serious issues with how we were working with data.

For one, querying data was a nightmare. By this time we had one of the largest MongoDB clusters in the world (top 3). For reliability reasons the infrastructure team had disabled Mongo aggregation queries, meaning aggregation of data had to be done on the client side (in a Python script). What should have been simple SUM and GROUP BY statements in SQL had to be written as Python scripts that iterated through millions of documents one at a time, keeping track of results in nested dict of dicts. These queries were painful to write and took forever to run.
The data pipeline situation wasn’t much better. The system was overly simple and lacked key features that made supporting a large amount of ETL tasks manageable, like dependency management and retry logic. Failures were brittle and cascaded, which made fighting fires almost a full time job.
We needed to rebuild the infrastructure — and fast. We needed to transition the data pipeline into a more scalable and reliable system. And we needed to build a separate data store for analytics that makes querying and building reports much faster.
What made this hard was that as one of the two analytics focused hires in the company, I had to juggle between keeping the current pipeline operational, keep up with large amount of reporting and data requests, and carving out time to rebuild the system. This meant frequently switching back and forth between data engineering and data analysis tasks — two types of work that require very different skills and thinking. By juggling both, I don’t think I did either role very well.
What ended up saving the day was our eventual first data analyst hires. We were lucky that we eventually found senior analysts technical enough that could write ad-hoc queries for MongoDB and work on our Python based email reports. They were was also experienced enough that they knew how to navigate undocumented and new data sources. This meant that they could take ownership of a lot of reporting tasks that I was buried under.
Over the next year, we built out the foundation of analytics at Wish. The analysts took on the fire-hose of data requests coming from all corners of the company. I was able to focus on rebuilding the infrastructure.
Neither myself nor our analyst team would have lasted very long at this company had either of us not joined the company. The two problems we worked on, pulling data/building reports and working to improve the infrastructure, were hard in very different ways. They required such separate skills that neither side was very good at each other’s role.
The main lesson is that the requirement of starting a data team is having both a data engineer and data analyst(s). Without at least one data analyst, the data engineer will be buried under reporting tasks and data pulls. Without the data engineer, data analysts will be burnt out from querying difficult data sources while dealing with the data requests fire-hose. Both types of hires have to be experienced. And both groups have to be able to grind it out for sometime until the system is built.
In the next two sections, I’ll talk in more detail about the challenges faced in each role and tips for how to mitigate them.
Joining as an Early Data Analyst
Being one of the first data analysts at Wish meant taking ownership over a large chunk of reporting, and being one of the first people in line to take on data requests.
Reporting was a system made up of Python scripts that generated HTML emails sent out at regular intervals. There were over a hundred of these, covering the different systems and functions within the company.
Keeping these scripts running on schedule was a full time job. Processing data using Python and covering all edge cases is hard. Issues like type errors, missing or incomplete data, and display issues, were all bugs that popped up daily and would cause reports to not send. There typically wasn’t enough time in a week to fix all of the things that came up, so reporting bugs had to be triaged and prioritized.
It wasn’t enough that we just kept the system operational. The growth of the company was generating lots of demand for new reports. We had just hired a new Head of Operations, which meant all of our customer service reports needed to be rebuilt. We were also launching new merchant programs such as Wish Express, our 7 day shipping option. Each of these programs needed its own set of reports.
On top of reporting, there was continuous stream of data requests coming from all sides of the company. It always seemed like the speed at which these came in was increasing exponentially. We had to be very selective about cutting down unnecessary asks, and prioritize working only on the most impactful requests.
This was a hard job. There was always a temptation to rush things in response to the volume of incoming work. This led to mistakes, which very quickly cut down an analyst’s credibility.
To succeed in this role means two things:
- To be able to deliver accurate data consistently
- To be able to handle an unreasonable volume of requests.
I’ll talk about these two in more detail — why they’re hard early on and how to overcome these difficulties.
On Not Sending Out Bad Data

Inexperienced data analysts tend to query data without fully knowing how things work.
To give you an example, let’s say we had a request for getting the current global refund rate. The naive way to get this would be to look at the data model for orders, and seeing that it has a refund reason field. By filtering on the existence of this, over all orders made in a given time frame, we can get a refund rate metric — # refunds / # orders. We then send it off.
Then let’s say we hear back, and now top brass wants to see how refund rate differs for packages that are shipped with delivery confirmation, and without. Naively, we could also apply the same method and find a seperate data model for order tracking, and see that it has a field called delivery confirmed time. And that it can be joined to an order from the first data model using tracking id, which exists in both models.
We write the same pull as before, but now condition on the existence of delivery confirmation time, to get two metrics:
- Refund Rate — Orders with Delivery Confirmation: X%
- Refund Rate — Orders without Delivery Confirmation: Y%
Simple enough. We then send it send out.
Did you see the mistake?
For Wish, order cancellations are considered refunds. Since cancellations means orders aren’t shipped yet, so they always end up in the second metric — refund rate for orders without delivery confirmation. This inflates the second refund rate substantially. Very bad decisions could be made from this.
This example actually happened in real life (thankfully caught quickly). Thinking back, anytime I took shortcuts and skipped understanding the system before pushing out data, I would eventually send out bad numbers.
Avoiding this trap takes experience. Anytime there’s work on a new metric or new data source the analyst is unfamiliar with, they need to spend extra time exploring the data and understanding the system. For the first few data analysts on a team, almost every task will involve working with new and unknown data.
It takes an experienced data analyst to know when to slow down. Even when facing large amounts of pressure and urgency.
On Handling a High Volume of Requests

In the early days of Wish, we were a handful of analysts and engineers covering the growth of a business that was doing multiple billion dollars in sales a year. We could have been a team of 20 and still would have been working hard to meet the demand for data.
We had to be good at prioritization. We would focus on completing the most important tasks, and defer and reject everything else.
But this is much easier said than done. What makes gives one request a higher priority than another? Do feature requests get pushed out before bugs? Which teams would receive the most help?
To answer this, we judged every request based on two criteria:
- The impact of completing the task
- The work required
Before we worked on task, we had to estimate its impact. This means we should think through how completing the task will affect that company. Relevant questions include:
- What are the areas of the business that this task affects, and the size of these areas
- Can we estimated the upside? In rough, order of magnitude?
- What is the chance of success?
- Is this task strategic for the company? Are we on the critical path for a larger initiative?
Once we have a rough idea of this, we should compare the estimate with the amount of work involved. We had a general idea of how long tasks would take. Bug fixes took half a day to a day, reports took two days to a week. And ad hoc data requests would take half a day.
This shouldn’t be an exact science. All we need is a very rough order of magnitude vs work required estimate that helps determine which requests should be worked on.
Following this framework, here was the general prioritization for incoming requests:
- Bug fixes generally had high priority. If someone asks for something to be fixed, we can assume they found that thing useful. So fixing it will generate positive value. Most of the time bug fixes were quick, so their impact vs work ratio is usually high.
- Feature requests had to be more carefully thought through. Will adding a new metric to this report or building a new report actually help the stakeholder make decisions better?
- Systems improvements, like consolidating reports or merging some common calculations into a seperate pipeline, generate positive value medium term, but low impact short term. These should be minimized to tasks that are necessary to keep the system from blowing up.
- The lowest priority tasks are ones without a clear goal in mind. This is when stakeholders are not sure of the problem that needs to be solved, and is looking for more data to explore. These should be pushed back as they will rarely lead directory to impact and tend to take up multiple iterations of work
If the request has impact, but involved more work than necessary, we would often trim requirements from tasks. If a metric was too hard to calculate, we would remove it from the request.
By prioritizing incoming work items, and focusing on the tasks with the most impact and the least amount of work, we were able to do the most with what little time we had.
To summarize, early on, data requests are hard to query for, hard to get accurate, and come at an unreasonable rate. Even following best practices, this is a recipe for burnout. Analysts can only hold out for so long.
The rest was up to data engineering. We needed better infrastructure.
Joining as an Early Data Engineer

The minimum viable product of data infrastructure includes:
- A data pipeline that can be used to transfer and crunch data
- A data warehouse that is optimized for analytical queries
- A business intelligence tool that can be used by analysts to quickly build charts
Note: An analytical database (OLAP) is very different than a production one used to power applications (OLTP). If confused, read this StackOverflow response
Implementing these would result in massive efficiency improvement. Creating a data source specifically for business analytics that is easy to query for reduced our development time per request by an estimated 5–7x.
Making the data easier to query also reduced the technical requirements for analysts, which made hiring a lot faster. We could train this skill later on the job if needed.
Building out this road-map is not just an engineering problem. We had to sell the idea of purchasing a business intelligence tool. Wish had an engineering focused culture that preferred to build things in house, so we had to find a way to overcome objections and get buy in across the company.
Below, I’ll talk about building out each piece of the data infrastructure. And some of the key lessons.
Rebuilding The Data Pipeline

At Wish, since the existing data pipeline was failing, rebuilding it was the first priority. We chose Luigi as our framework to rebuild it on.
Luigi is an ETL framework that took care of a lot of the issues the pipeline was facing:
- The current pipeline was using cron scheduling to define dependencies. This was hacky and caused failures to cascade. Luigi has dependency management built into tasks.
- The current pipeline had failures that required time consuming manual reruns. Luigi is idempotent, meaning it remembers which tasks are successful and reruns only failed tasks. This makes recovery of failures easy to deal with.
- The current pipeline was taking longer than 24 hours to run a day’s worth of jobs. Luigi has a scheduler, that makes sure one ETL job can’t run twice at the same time. From this, we could scale out a single task graph across several machines, and cut the runtime by over half.
Over two months, I migrated over 200 ETL jobs over from our old system and various cron scripts.
Migrating ETL jobs to another platform turned out to be non trivial. The project was delayed near the beginning when I tried to do too much at the same time. After migrating some pipelines over to the new system, I also spotted and decided to fix some time zone issues in the ETL code. The result was a new system that was extremely hard to validate.
I learned a few lessons from this project that was nicely summarized in a recent article I read on how to improve legacy codebases:
- Try not to change too many things at the same time
- Don’t change the business logic when changing infrastructure
- Automate testing with validation scripts
The main risks with refactoring is that you can introduce a ton of new bugs. With over 200 ETL jobs to migrate, being laissez faire with keeping the end result of the system the same would have killed the project.
So the easiest way to deal with this is introduce small changes that can be automatically validated using a test framework and matched to the old system. Changes that change the end result should be avoided until the entire project is finished.
For this project, this meant building a test tool that gave pass/fail to migrated pipelines, by comparing its output to the old pipeline.
The new system based on Luigi was barebones. But it was stable, and handled its own failures. It was something we could rely on as we built out the rest of the data infrastructure.
Building The Data Warehouse

A data warehouse is a database that makes writing and running analytics queries fast. Usually it includes tables that are easy to understand and query — a much cleaner representation of production tables.
For example, one of the most frequently used tables in our now data warehouse is called merch_merchanttransaction. This is a table where each row represents everything about an order that an analyst might want to know about. Instead of time consuming MongoDB joins to get order + tracking data or order + refund information, analysts can write queries on this single table and usually get results in minutes, vs hours spent querying MongoDB.
Rolling out a data warehouse is super easy. We just had to re-use a lot of the work that had already been done in building out reporting.
We could bootstrap the design of our tables by looking at the most important existing reports, and pick out the most important metrics and dimensions. We could then re-purpose the code that generated these numbers in the reports, into data pipelines that pushed out more granular records to our chosen data store.
This process took less than three weeks. At the end, we had a data warehouse that covered a large % of the company’s processes and could be used to speed up analyst queries.
We chose Redshift as our database. We were already using Hive (TreasureData) for application logging, so we re-used it for dumping and computing our new tables. TreasureData has a Redshift integration, which we used to send exact copies of these tables to a our Redshift cluster.
Deploying Business Intelligence Tooling

Reporting was originally done via HTML emails, sent off by python scripts. This is actually very effective:
- Since these were just Python scripts that sent off HTML formatted data, reporting tasks could be assigned to any engineer on the team.
- There was no limitation on how tables and charts could be formatted and displayed, unlike more rigid structures found in BI tooling. The report could be exactly designed for the system.
But there were limitations, which made this system hard to grow:
- These reports were difficult to write and test — sometimes taking up to a day to run.
- There were no drilldowns and filtering, so different views on the same data would have to be carved out in several reports.
- Modifying these reports with even the smallest change took time since testing was lengthy, and over time there was a large codebase to maintain.
To fix this, we needed to deploy a business intelligence tool, that handled fast visualization on top of a data warehouse.
Implementation would be easy. Modern cloud based SaaS solutions are more or less plug and play.
The blocker was getting purchase approval. How do you convince a decision maker (our CTO), that we needed to purchase a tool to speed up reporting, when he has no direct connection to any of the pain points listed above? All he sees is the end result — email reports. And to him, this system was working fine.
But the pain points in reporting did exist, and every engineer that worked on email reports felt it. Eventually I had enough buy in at the middle management level to kick off the selling process.
From start to finish, this acquisition process for Looker took around two months. In order, here were the steps required:
- A presentation to my manager (Head of Platform) about the potential added value of Looker, including estimates of increased time to dashboard and work saved
- Getting buy in from stakeholders in business operations, based on how fast Looker was going to make building reports for them
- Getting buy in from Jack, our Head of Data, based on support from 1+2
- Negotiating a trial phase for Looker, so we could build out our initial dashboards (4 weeks)
- Using this time to build out a basic set of dashboards for the company (20 dashboards)
- Presenting the data from this trial phase, a refined model for ROI based on time saved per dashboard, and presenting to the CTO for final approval
This might sound very bureaucratic. But the decision to roll out a tool used company wide has to be carefully considered. This process makes sure that the impact has been thought through, from the point of view of all users that will eventually depend on the system for data.
By presenting an ROI based argument based on cost savings in headcount reduction and efficiency improvements vs price of Looker and Redshift, we were able to push past objections about build vs buy, and using alternative free tooling.

With Looker rolled out, we had successfully rebuilt the foundation of analytics at Wish. From here, we could scale out headcount and starting meeting the demand for data that’s been so backlogged in the company. It was a huge milestone.
For the rest of the article, I’ll talk about next steps. How to scale out data engineering & analyst teams, and how to hire and manage for high performance.
